Geant4
Microbeam Advanced Example
Interface
Physics Biology group
( S. Incerti*, O. Boissonnade,
C. Habchi, Ph. Moretto, D. T. Nguyen, T. Pouthier, H. Seznec, Q. Zhang )
Centre
d’Etudes Nucléaires de Bordeaux-Gradignan (CENBG)
IN2P3 / CNRS /
33175 Gradignan
* corresponding author e-mail
: incerti@cenbg.in2p3.fr
INTRODUCTION
The microbeam example simulates the microbeam
cellular irradiation beam line installed on the AIFIRA electrostatic
accelerator facility located at CENBG,
For more
information on this irradiation facility, please visit :
Schematic view
of the CENBG five AIFIRA beam lines :
the microbeam line is located at 10° from the main
exit of the switching magnet (© CENBG)

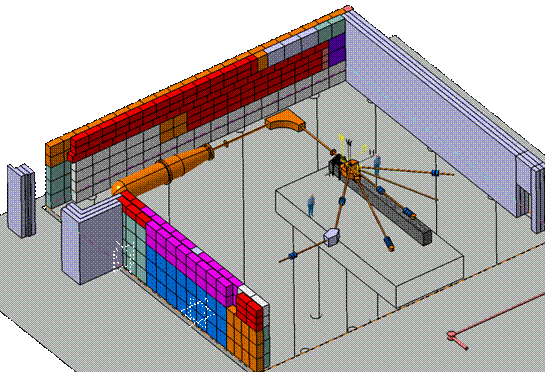
View of the
CENBG microbeam line (© CENBG)
SIMULATED SETUP
The beam
is emitted just before the 10° switching magnet taking into account
experimental beam parameters measurements ; the main
elements simulated are :
1. A switching
dipole magnet with fringing field, to deflect by 10° the 3 MeV
alpha beam generated by the electrostatic accelerator into the microbeam line, oriented at 10 degrees from the main beam
direction;
2. A circular
object collimator, defining the incident beam size at the microbeam line entrance; the collimator has been simulated
from realistic electron microscopy images;
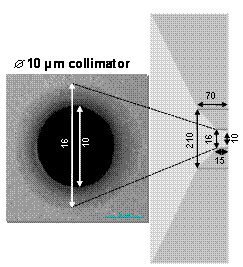
Collimator geometry implemented in Geant4 as embedded
cones
3. A quadrupole
based magnetic symmetric focusing system allowing equal
transverse demagnifications of 10. Fringe fields are calculated from Enge’s
model.
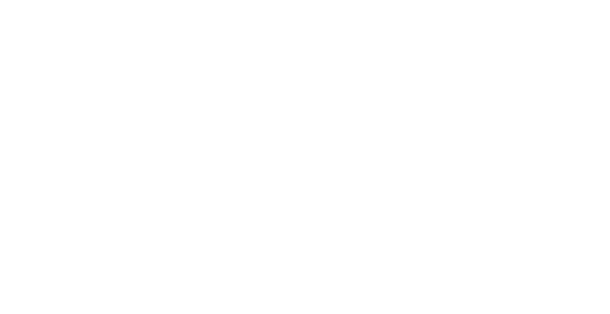
Geant4 fine
ray-tracing of beam profile inside the focusing quadruplet in both horizontal
and transverse planes, showing the beam focus point.
4. A dedicated cellular
irradiation chamber setup, taking into account all the elements
encountered by the incident beam (diaphragm, gas detector, isobutane,
beam extraction window, air, culture foil, culture medium, cell dish…) ;
5. A set of
horizontal and vertical electrostatic deflecting plates which
can be turned on or off to deflect the beam on target;
6. A realistic
human keratinocyte voxellized
cell observed from confocal microscopy and taking into
account realistic nucleus and cytoplasm chemical compositions. The phantom uses
the G4PVParameterised class.

Confocal
microscopy image of a HaCat cell showing the cytoplasm (red) and the nucleus
(purple)
© CENBG

Corresponding
Geant4 phantom showing four incident alpha particles penetrating the cell.
The phantom is made of voxels with a size of 489 nm (X) x 489 nm (Y) x 163 nm
(Z).
Approximately 4x10⁴ voxels are shown.
PHYSICS
Low energy
electromagnetic processes (for alphas, electrons, photons) and hadronic elastic and
inelastic scattering for alphas are activated by default. Low
energy electromagnetic electronic and nuclear stopping power
are computed from ICRU tables.
CODE DESIGN
The Microbeam code design obtained from the Rational Rose
software is shown below.
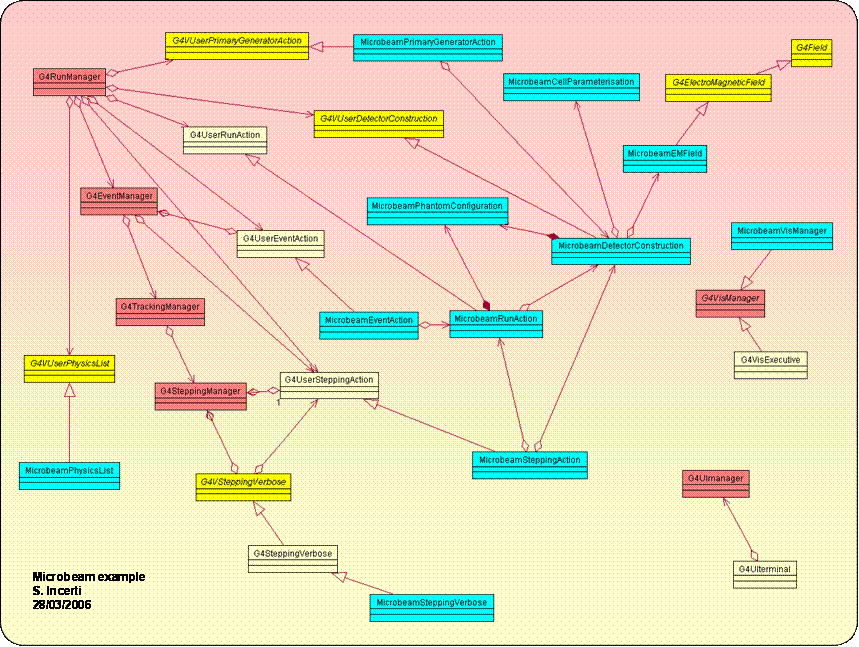
Rational Rose class diagram of the
Microbeam example.
Manager classes are filled with red and Microbeam classes are filled with sky blue.
SUGGESTED
PAPERS ABOUT THIS SIMULATION AND ITS VALIDATION
These papers can be accessed online
at the SLAC-SPIRES online database by clicking here
► Monte
Carlo microdosimetry for targeted irradiation of individual cells using a
microbeam facility
By
In preparation
(2007)
► Monte Carlo simulation of the CENBG microbeam
and nanobeam lines with the Geant4 toolkit
By S. Incerti, Q. Zhang, F. Andersson, Ph. Moretto, G.W. Grime, M.J. Merchant, D.T. Nguyen, C. Habchi, T. Pouthier and H. Seznec
In
press in Nucl.Instrum.Meth.B,
2007
► A Comparison of cellular irradiation techniques with alpha particles
using the Geant4 Monte Carlo simulation toolkit
By S. Incerti, N. Gault, C. Habchi, J.L.. Lefaix, Ph. Moretto, J.L.. Poncy, T. Pouthier, H. Seznec. Dec
2006. 3pp.
Published in Rad.Prot.Dos.,1-3,2006
(Micros 2005 special issue).
► GEANT4
SIMULATION OF THE NEW CENBG MICRO AND NANO PROBES FACILITY
By
Published
in Nucl.Instrum.Meth.B249:738-742, 2006
► A Comparison of ray-tracing software for the design of quadrupole
microbeam systems
By S. Incerti et al.,
Published in Nucl.Instrum.Meth.B231:76-85, 2005
► DEVELOPMENT OF A FOCUSED CHARGED PARTICLE
MICROBEAM FOR THE IRRADIATION OF INDIVIDUAL CELLS.
By Ph.
Barberet, A. Balana, S.
Incerti, C. Michelet-Habchi, Ph. Moretto, Th. Pouthier. Dec 2004. 6pp.
Published
in Rev.Sci.Instrum.76:015101, 2005
► SIMULATION OF CELLULAR IRRADIATION WITH THE CENBG
MICROBEAM LINE USING GEANT4.
By S.
Incerti, Ph. Barberet, R. Villeneuve,
P. Aguer, E. Gontier, C. Michelet-Habchi, Ph. Moretto, D.T. Nguyen, T. Pouthier, R.W. Smith. Oct 2003. 6pp.
Published
in IEEE Trans.Nucl.Sci.51:1395-1401, 2004
► SIMULATION
OF ION PROPAGATION IN THE MICROBEAM LINE OF CENBG USING GEANT4.
By S. Incerti, Ph. Barberet, B. Courtois, C. Michelet-Habchi, Ph. Moretto. Sep
2003.
Published in Nucl.Instrum.Meth.B210:92-97, 2003
HOW TO INSTALL
AND RUN THE EXAMPLE
Please, look at
the README file provided with
the example.
SIMULATION
RESULTS
This example does
not need any external analysis tool. The output consists in several text
(*.txt) files which are created directly in the microbeam
directory :
►
dose.txt : gives
the total deposited dose in the cell nucleus and in the cell cytoplasm for each
incident alpha particle;
►
3DDose.txt : gives
the average dose deposited per voxel per incident
alpha particle;
►
range.txt :
indicates the final stopping (x,y,z) position of the
incident alpha particle within the irradiated medium (cell or culture medium)
►
stoppingPower.txt : gives
the actual stopping power dE/dx of the incident alpha
particle just before penetrating into the targeted cell;
►
beamPosition.txt : gives
the beam transverse position distribution (X and Y) just before penetrating
into the targeted cell;
These files can
be easily analyzed using the provided ROOT macro file plot.C. Fore more
details, please refer to the README file. The
ROOT website is available at : http://root.cern.ch. The macro gives
the following graphical output :
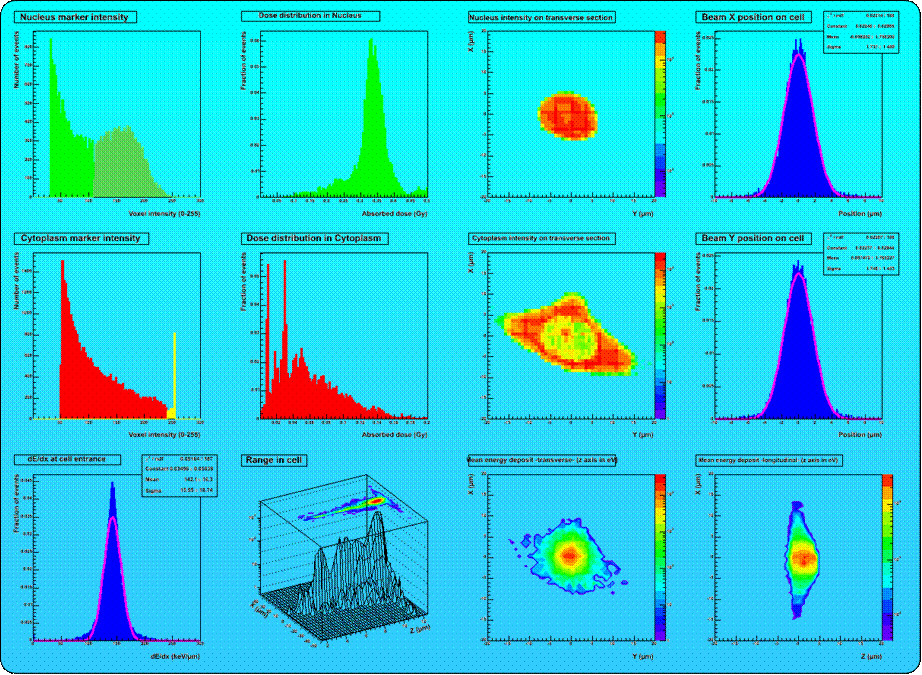
Typical
graphical output from the plot.C macro file
obtained for 2x10⁴ incident alpha particles :
TOP row
left
plot : nucleus voxel intensity
(0-255) distribution, two density zones have been isolated in the simulation
middle
left plot : alpha dose deposit in nucleus
middle
right plot : nucleus voxel intensity
projected on cell transverse section
right
plot : beam transverse (X) position distribution on target.
The sigma of the Gaussian fit is compatible with the measured experimental
value.
MIDDLE row
left
plot : cytoplasm voxel
intensity (0-255) distribution, two density zones have been isolated (one for pure
cytoplasm in red, the other for nucleoli in yellow)
middle
left plot : alpha dose deposit in cytoplasm
middle
right plot : cytoplasm voxel
intensity projected on cell transverse section
right
plot : beam transverse (Y) position distribution on target.
The sigma of the Gaussian fit is compatible with the measured experimental
value.
BOTTOM row
left
plot : beam stopping power dE/dx
distribution at cell entrance
middle
left plot : 3D distribution of alpha particle range in cell or
medium
middle
right plot : projected mean energy deposit per voxel (transverse, z axis is in eV)
right
plot : projected mean energy deposit per voxel
(longitudinal, z axis is in eV).
The
simulation predicts that 95% of the incident alpha particles detected by the
gas detector are located within a circle of 10 µm in diameter on the target, in
nice agreement with experimental measurements performed on the CENBG setup.
FUTURE
Running this
example requires a large amount of memory and CPU time. Decrease of memory use
and acceleration of navigation could be investigated using nested
parameterization. Microdosimetry with other geometries like 3D tissues will be
investigated.
CONTACT
Should you have
any enquiry, please do not hesitate to contact the corresponding author : incerti@cenbg.in2p3.fr
Last modified by